Summary#
You have a stack of documents or interviews and you want conclusions you can defend. This is one workflow for getting there: nine steps, from planning through coding to a final judgement. It is built around the Causal Map app and aimed at AI-supported coding at scale, but most of it works just as well for hand coding.
The work falls into three acts (the old Task 1, 2 and 3). Plan (Steps 1 to 2): decide what you want to answer and gather data that can answer it. Code (Steps 3 to 5): turn the text into a checked table of causal claims, each with a quote and a source. Query (Steps 6 to 9): weigh that evidence and use it to answer the question. The shape is a few cheap, wide passes to capture the evidence, then steadily narrower judgement, so a thousand raw claims might end as a few dozen well-vouched links and one conclusion you can stand behind.
Its companion, Quality assurance at each step, goes through the same steps and asks how to keep each one rigorous. For step-by-step app instructions see AI coding; for why we use AI as a low-level coder rather than a black box, see AI in evaluation actually show your working! and Just add rigour Three do’s and don’ts.
About causal mapping#
Causal mapping analyses what people say in interviews, focus groups or reports when you want to know what they think causes what. You read the material and code each causal claim ("the rains ruined the harvest", "the training raised her confidence") as a link from one factor to another. Combine the links from many sources and you have a causal map: a network of what people believe drives what. For a fuller introduction see this and this.
It is like systems mapping, but instead of modelling how the world works we first record what people claim about it, and only later, if at all, ask what is really going on.
We code in the minimalist style: a link records only that "a source says X influenced Y", with a quote. No polarity, no strength, no fitted curves, no counterfactual the speaker never gave. The case for that is in Minimalist coding for causal mapping.
The nine steps#
- Overall planning
- Data gathering
- Manage the codebook
- Code the claims
- Check and enrich individual links
- From claims to bundles
- From bundles to pathways
- Judge value and relative contribution
- Holistic judgement
The steps are not a strict sequence. You will revisit the early ones as results come in, and only the last is strictly required; most projects use a handful.
Four tensions behind the coding choices#
Setting up a coding run (Steps 3 and 4) means a cluster of choices: how strict a codebook, holistic or claim by claim, chunk size, model, labels, columns, context, iterations. They look like separate knobs, but they pull on the same four tensions, so moving one usually moves the others.
- Precision and recall. Are the links right (precision), and did you catch them all (recall)? Almost every choice below trades one against the other.
- Freedom against control. We use the model as a clerk, not an oracle. Every choice about how much rope to give it, to pick the story (holistic), invent labels (a loose codebook) or run unattended (one-click), sits on this line. Steps 5 to 9 are where you take judgement back.
- Capture now, judge later. Coding close to the text, tolerating messy overlapping labels and tidying up afterwards are all the same bet: grab it cheaply now, commit late. Quotes and hierarchical labels are what let you re-check or roll up later without recoding.
- Cost and time. Sampling, model choice and iteration count mostly decide how much you spend tuning the other three.
| Decision | Why it matters | Sensible default |
|---|---|---|
| One-click or hands-on | Freedom and control | One-click for a single short text; hands-on otherwise |
| Codebook strictness | Freedom and control; capture now, judge later | Looser and close to the text first; tighten by recoding |
| Holistic or claim by claim | Freedom and control; recall | Claim by claim for many texts; holistic for one short text |
| Chunk size and sampling | Recall; cost | Smaller chunks for recall; sample first on a big corpus |
| Model | Precision and recall; cost | Gemini Flash; bigger is not always better |
| Label style | Capture now, judge later | Close to the text, often hierarchical; abstract later |
| Custom columns | Precision and recall (each column has a cost) | Keep them off the main pass; add in a later iteration |
| Context and named entities | Recall | Brief and specific |
| Iterations | Precision and recall; cost | One good instruction usually beats a second pass |
| Recoding | Capture now, judge later | Defer consolidation; a hard recode gives the best result |
Step 1: Overall planning#
Start from the question. Before anything else, write down what you want to be able to say at the end, and to whom. Everything downstream, the data you gather, the labels you allow, the columns you add, the queries you run, follows from that.
Be realistic about what causal mapping can and should answer. It is good at: which factors matter most, what influences or follows from a given factor, how different groups see things, how well the evidence supports a pathway or a theory of change, and the overall shape of the system. It will not give you effect sizes, and on its own it does not prove that X causes Y; that judgement stays with you (see Quality assurance at each step of the causal coding workflow). So pick questions the method can serve, and only as many as the evaluation needs. The menu of question types is in the questions chapter.
It helps to sketch, before you code, the map or table that would answer your question: which factors, which comparison, which pathway. That sketch is your target.
Treat the question as a first draft. Causal mapping is partly exploratory, so expect to sharpen it once early coding shows you what the sources actually talk about.
Step 2: Data gathering#
The question decides the data. Work out which sources you need, from whom, and covering what, so the comparisons you care about are possible later. If you will want to compare women and men, or staff and clients, or early and late, those groups have to be in the data and recorded in the source metadata, which Step 5 and the query steps lean on.
Narrative material works best: ask people what changed and why, and you get causal claims to code. QuIP-style "stories of change" are gathered in exactly this way (Copestake et al. 2019).
Gathering is a craft of its own and we only touch it here; this paper picks up in earnest once you have text to code.
Step 3: Manage the codebook#
You can start from nothing (free coding), from a fixed codebook such as a theory of change, or somewhere between, and you will often revise it more than once.
How free should it be? Four common choices:
- Forced: only your labels; anything else is dropped.
- Mostly fixed: your labels, but let the model add new ones, flagged (for example
[new]) for review. - Hierarchical compromise: fix the top level, let the model fill in the detail (see Hierarchical coding).
- Free: the model invents everything.
Loose coding finds more but leaves more to tidy; tight coding is cleaner but misses links. If you allow too many off-codebook labels you face a lot of recoding; if you allow too few, your maps thin out and you wonder why you bothered finding the links at all.
Recoding#
Recoding is how you revise the codebook after a first run, which is why it belongs here. Once you have coded, you deal with overlapping labels (see Different kinds of coding and recoding):
- Hard recode: rewrite the codebook and code again. Most work, best results.
- Links or factors recode: clean up with AI Answers.
- Soft recode: cluster or magnetise labels into a smaller set.
Step 4: Code the claims#
Coding means writing an instruction for the AI, much like a chatbot prompt, that you paste into the app. It tells the app the context and what labels and columns you want. You do not need to add the text itself; the app does that.
In a hurry, or coding just one short text? Press One-click: the app codes with all defaults (holistic, no codebook), chunks long texts for you, and tidies overlapping labels. Often that is enough. The rest of this step is for when you want control.
The golden rule: test your instruction on a small, varied sample, work out exactly why the output is wrong or thin, change it, and run again, until you are happy. Then scale up.
Holistic or claim by claim#
Holistic coding asks the model for one connected diagram per chunk. You get a cleaner, joined-up story, best for a single short text, but the model has more freedom over what to include. (Oddly, asking for a diagram yields better-connected networks than asking for a list of links; under the hood we ask for a diagram and convert it.) Claim-by-claim coding asks for every link separately. You get fuller coverage, better for many texts, but the links join up less and you rely on recoding to rejoin chains: if the text says A to B to C to D and the model codes A to B and C to D with slightly different middles, a later recode has to spot that they match.
| Dimension | Holistic | Claim-by-claim |
|---|---|---|
| Main aim | One connected network | Every link in the text |
| AI freedom | More: it picks the story | Less: it just finds links |
| Connectedness | Higher | Lower; needs recoding to rejoin chains |
| Best for | One short text | Many texts, or exhaustive coverage |
| Recall | Often secondary | Usually as important as precision |
| Repeated claims | May miss them | More likely to catch them |
| Quotes | One per link | One per link |
Holistic versus claim-by-claim coding
Chunk size and sampling#
The more text you give the model at once, the thinner its coding: one page can yield as many links as five. For better recall use smaller chunks, and do not leave the model to decide what counts as important. On a big corpus, sample first: with 1000 pages, code 100, review, code another 300, and if it holds up finish the rest. Make the sample random, or stratified by the groups you care about, so you do not tune to one untypical slice (see selecting random samples).
Model#
Bigger or newer is not always better. Gemini Flash is the default and often enough. More capable models with larger context windows should do better on bigger chunks, though we have not tested that formally.
Always ask for quotes#
Insist on a verbatim quote for every link. Without it you cannot show your working, and the result is not something you could defend as evidence. The app does not enforce this, so put it in your instruction.
Labels#
Decide how labels should read: close to the text (in vivo) or more abstract ("talk like a social scientist"). For client-readable, recode-friendly labels a semi-quantitative house style helps, such as "more income" or "lack of resources" (see this). Two devices earn their keep:
- Tags: bracketed text on a label, such as
patients (before surgery), to build labels from parts. - Hierarchical labels with a separator, which let you zoom out later (see Hierarchical coding).
For coding opposites and sentiment, see !Opposites and sentiment in AI coding.
Custom columns#
Besides the fixed columns (cause, effect, source, quote), you can ask for custom columns: any attribute you can code consistently across links, such as sentiment. (Tags describe factors; columns describe links.) Each extra column costs you some precision or recall, so keep them off the main pass and add them in a later iteration if they matter. Quality columns for checking links, such as conviction and strength, come in Step 5. More on columns: Adding and using custom columns for your links.
When you free-code without a codebook, a sentiment column is worth adding: the app groups labels by meaning, and "less X" lands right next to "more X", so a sentiment column keeps them apart.
Context and named entities#
Give the model enough background to know the job: the project, the audience, and the names, abbreviations and preferred phrasings specific to your work, so it settles on one consistent label where the text uses several. Keep it short; more than a page of context can start to cost you recall (see You have to tell the AI what game we are playing right now).
Iterations#
You can run extra passes over the same text (separated by ====; the app handles this). Use them to check accuracy, mop up missed links, or add a column. Each pass roughly multiplies time and cost, and a better first instruction usually beats a second pass. A follow-up might say:
Check for mistakes and correct them.
Delete links with too little evidence, or where you assumed a cause or effect.
Only the final pass feeds the app.
Step 5: Check and enrich individual links#
However careful the coding, some links will be wrong, so check and enrich them before you analyse. You will often see bundles: several links between the same cause and effect, from different sources or different parts of one source (see Bundle of Links — definition).
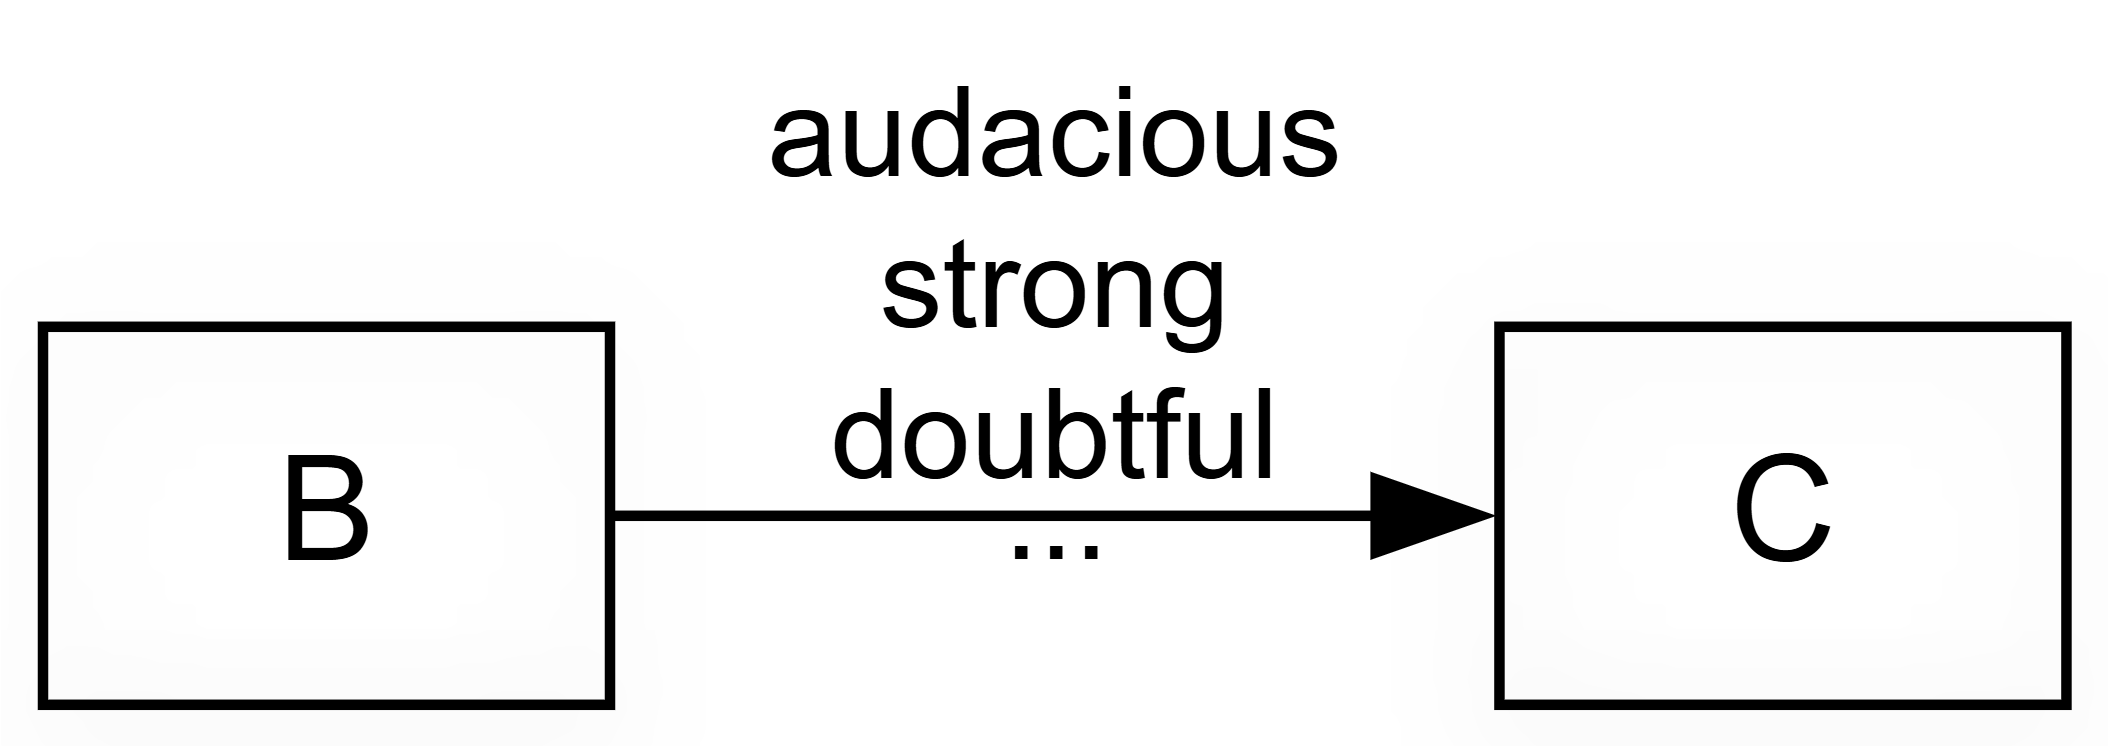
Start by tagging. A free tag such as #doubtful or #surprising records a misgiving you can filter on later.
Then add columns if they help:
- Conviction: how sure the source sounds (weak, neutral, strong). Most claims are unmarked, so most sit at neutral. This records the source's confidence, not the strength of the link.
- Strength: whether the source explicitly calls the influence strong or weak. Again, usually neutral.
Do not read these as scores like 1, 2, 3: neutral means "not mentioned", not "medium". That most people never mention strength does not mean they think it is medium; often the idea simply does not apply (on why we resist coding strength, see Our approach is minimalist — we do not code the strength of a link).
You can also score sources rather than links, for example reliability or role. Because every link has a source, those scores reach every link for filtering.
Steps 6 to 9: querying the model#
Your coded, checked links are now a model you can query (see Causal mapping produces models you can query to answer questions). Many questions can be answered the moment coding is done, straight off the links: which factors come up most, what drives or follows from a factor, how groups differ, what is surprising. The four steps that follow are for the harder questions that need defensible answers, where you weigh the evidence rather than just count it. The full menu is in the questions chapter; here is where each kind of query lands.
| Question | Where |
|---|---|
| Top factors, drivers and outcomes; what influences or follows from X; group differences; surprises; network shape | straight off the links, from Step 5 |
| How robust is the evidence that X influences Y? | Step 6 |
| Pathways from X to Y, indirect ones included, without the transitivity trap | Step 7 |
| Relative contribution; rival explanations; does the evidence fit the theory of change? | Step 8 |
| A typical source's story; does the whole thing hold together? | Steps 7 and 9 |
Step 6: From claims to bundles#
A bundle is the set of claims that all say the same X influences Y, from different sources or different parts of one source. Whatever else you do, weighing each bundle as a whole is part of quality assurance: how many sources, how convincing, do they agree or pull apart? Always look at your bundles this way before you build on them. This step has its own paper: Assessing quality or robustness of evidence for a causal link based on a bundle of coterminal causal claims.
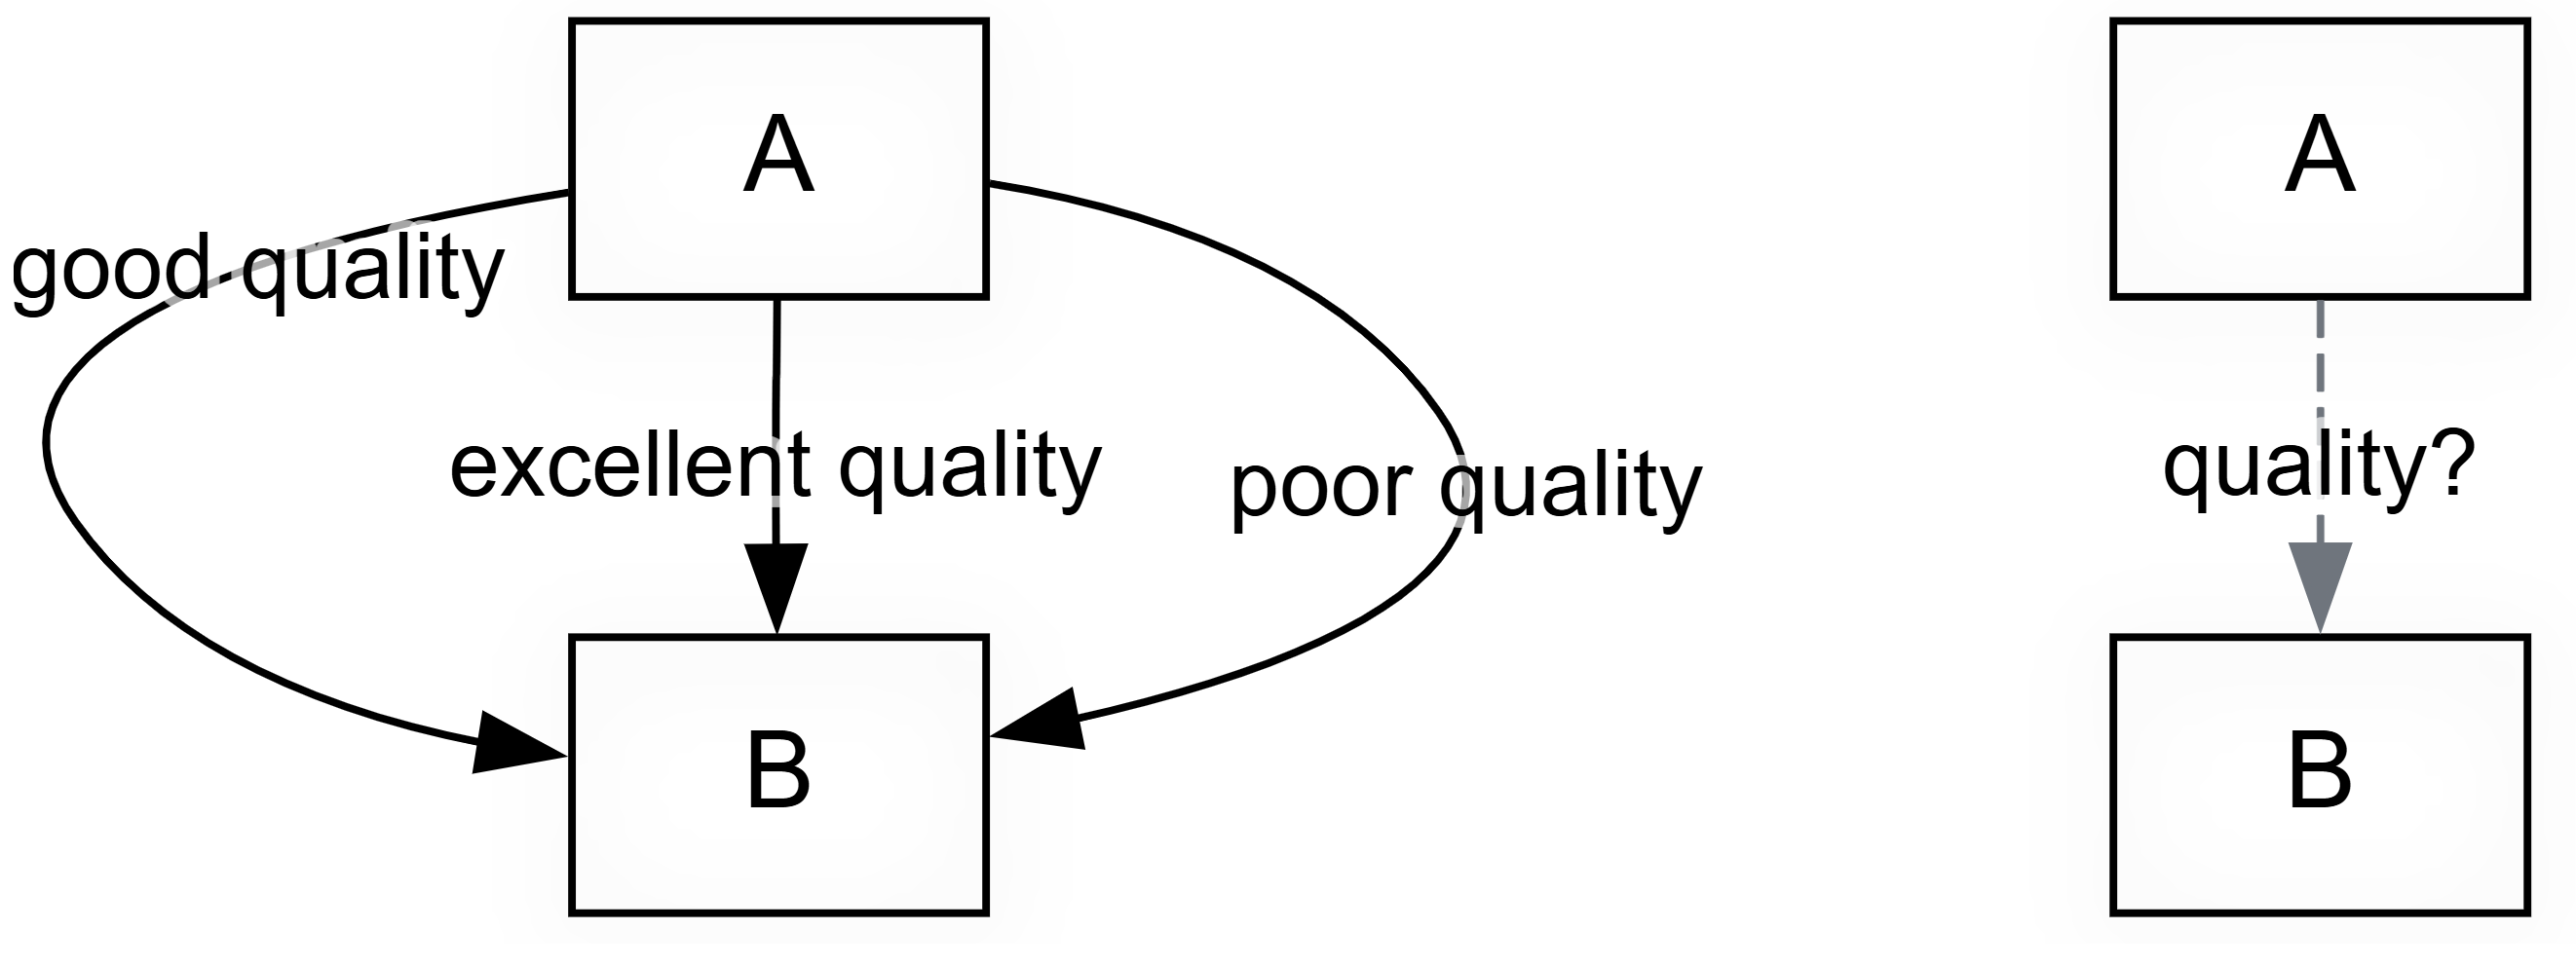
Once coding and cleaning are done, decide which bundles you will take seriously: the ones that survive your filters, perhaps after zooming to a higher level or restricting to certain sources. There might be five or a hundred. This is the evidence the rest of your analysis rests on.
You can stop there, having weighed the bundles by eye. Or you can record that judgement formally. Causal Map has a newer, optional feature that collapses a bundle into a single assessed link between the two factors, carrying your quality scores and, by default, the bundle's citation and source counts. The underlying claims are not deleted: a switch shows either the assessed links or the unassessed bundles, never both at once. Thin bundles can yield no assessed link, or one marked "Passed? = Fail".
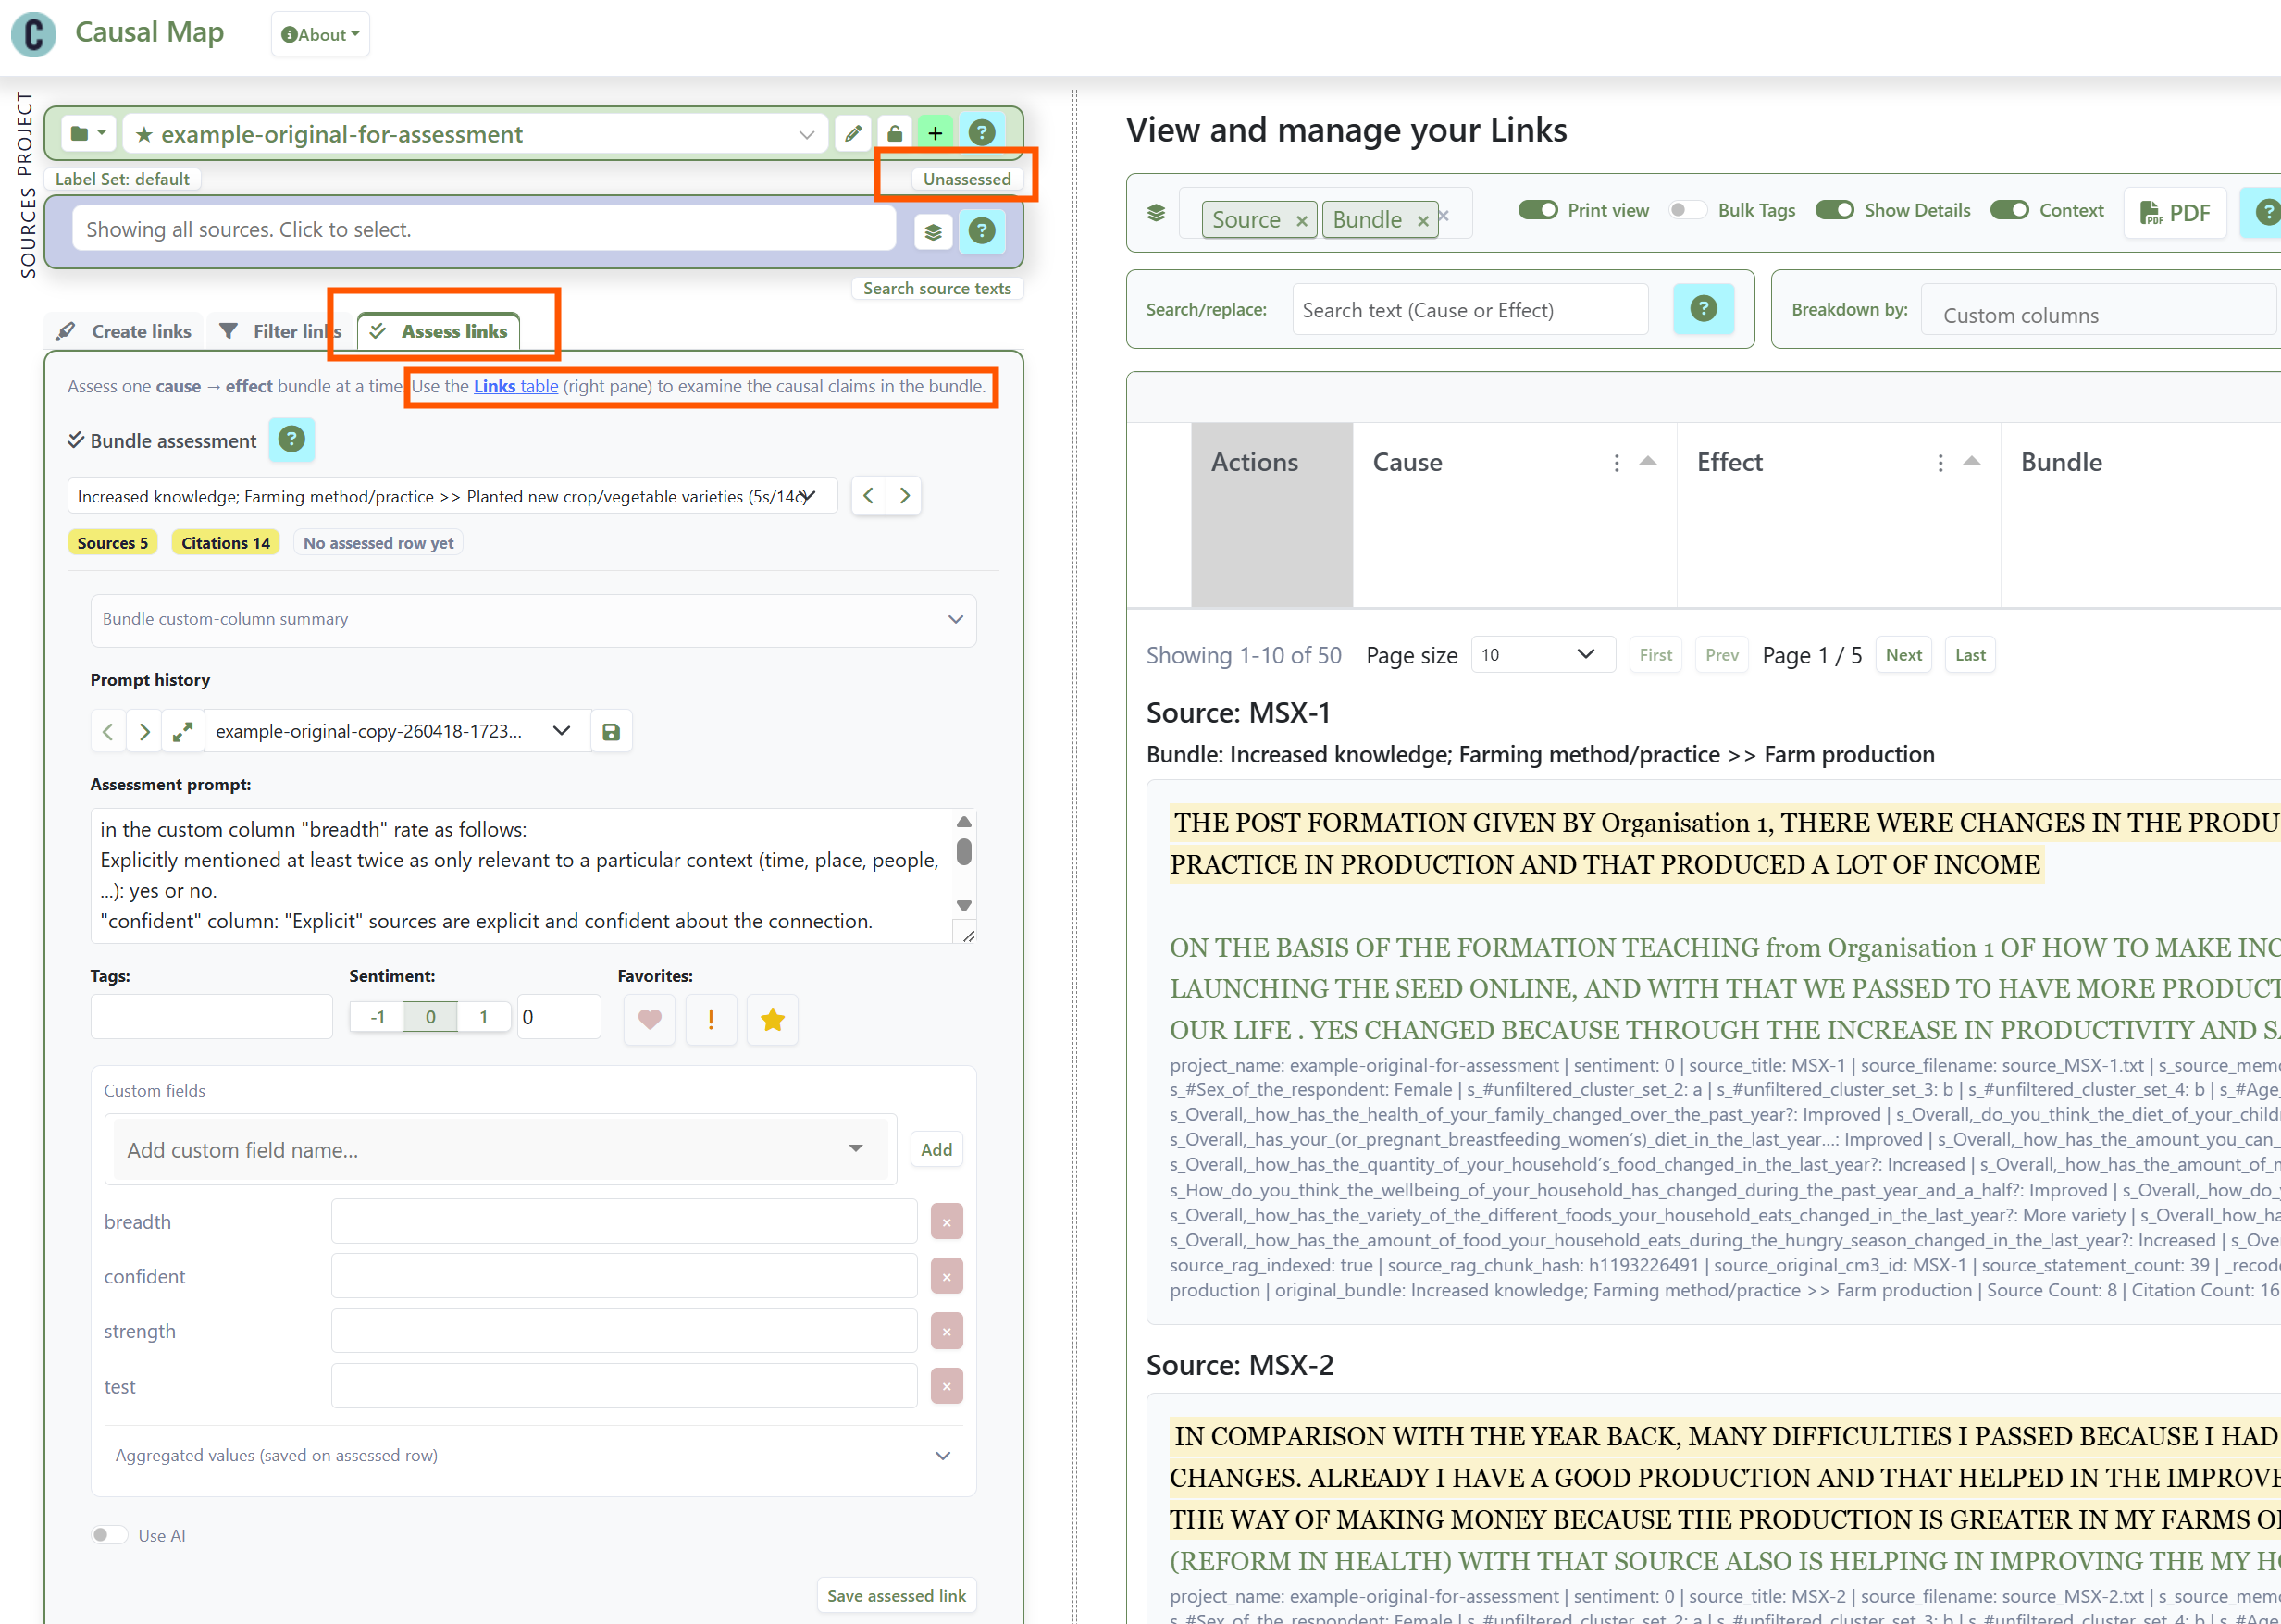
You can do this by hand, or let the AI take a first pass against your rubric and review it. The app will not create assessed links until you have written that rubric down, on purpose. The rubric can be a yes/no, a 1-to-5 scale like the one in Jewlya Lynn's seafood retrospective (Lynn 2025), or several dimensions such as confidence and triangulation.
Either way, formal or by eye, the move is the same: from a mass of raw claims to a smaller set you are willing to vouch for. A project might go from 1000 raw claims to 30 bundles to 25 assessed links, a much cleaner basis for argument.
Step 7: From bundles to pathways#
Now you can ask about pathways, often indirect, from an intervention to an outcome.
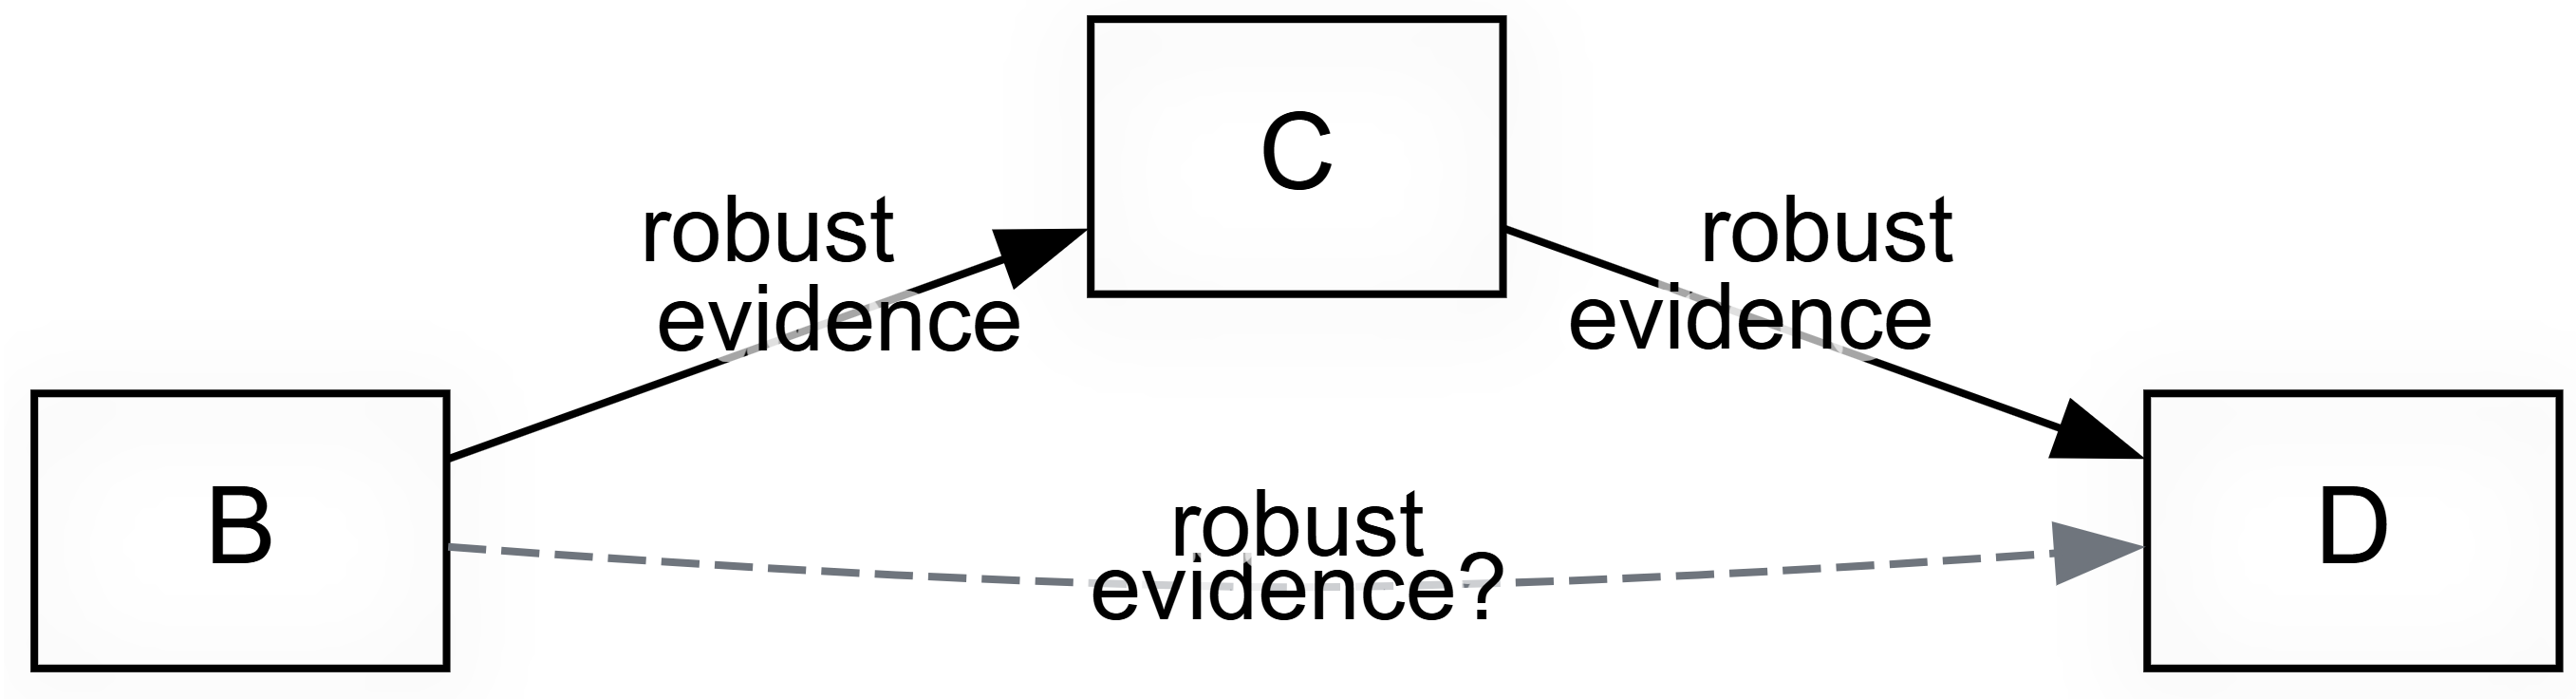
Even with every link well grounded you are not done, because conclusions usually run across a web of indirect links, from B1 and B2 to C via E, F and G. Two tools help.
Path tracing keeps only the links on some route between your chosen start and end factors, within a set number of steps (see Path tracing and source tracing).
But "A influenced B" and "B influenced C" does not give you "A influenced C": the contexts may not overlap. This is The transitivity trap, the biggest pitfall of any causal diagram, and the heart of the companion QA paper. Source tracing is the safe move: it keeps only sources whose own account runs all the way from A to C, so every link belongs to at least one complete story and you can review the evidence source by source.
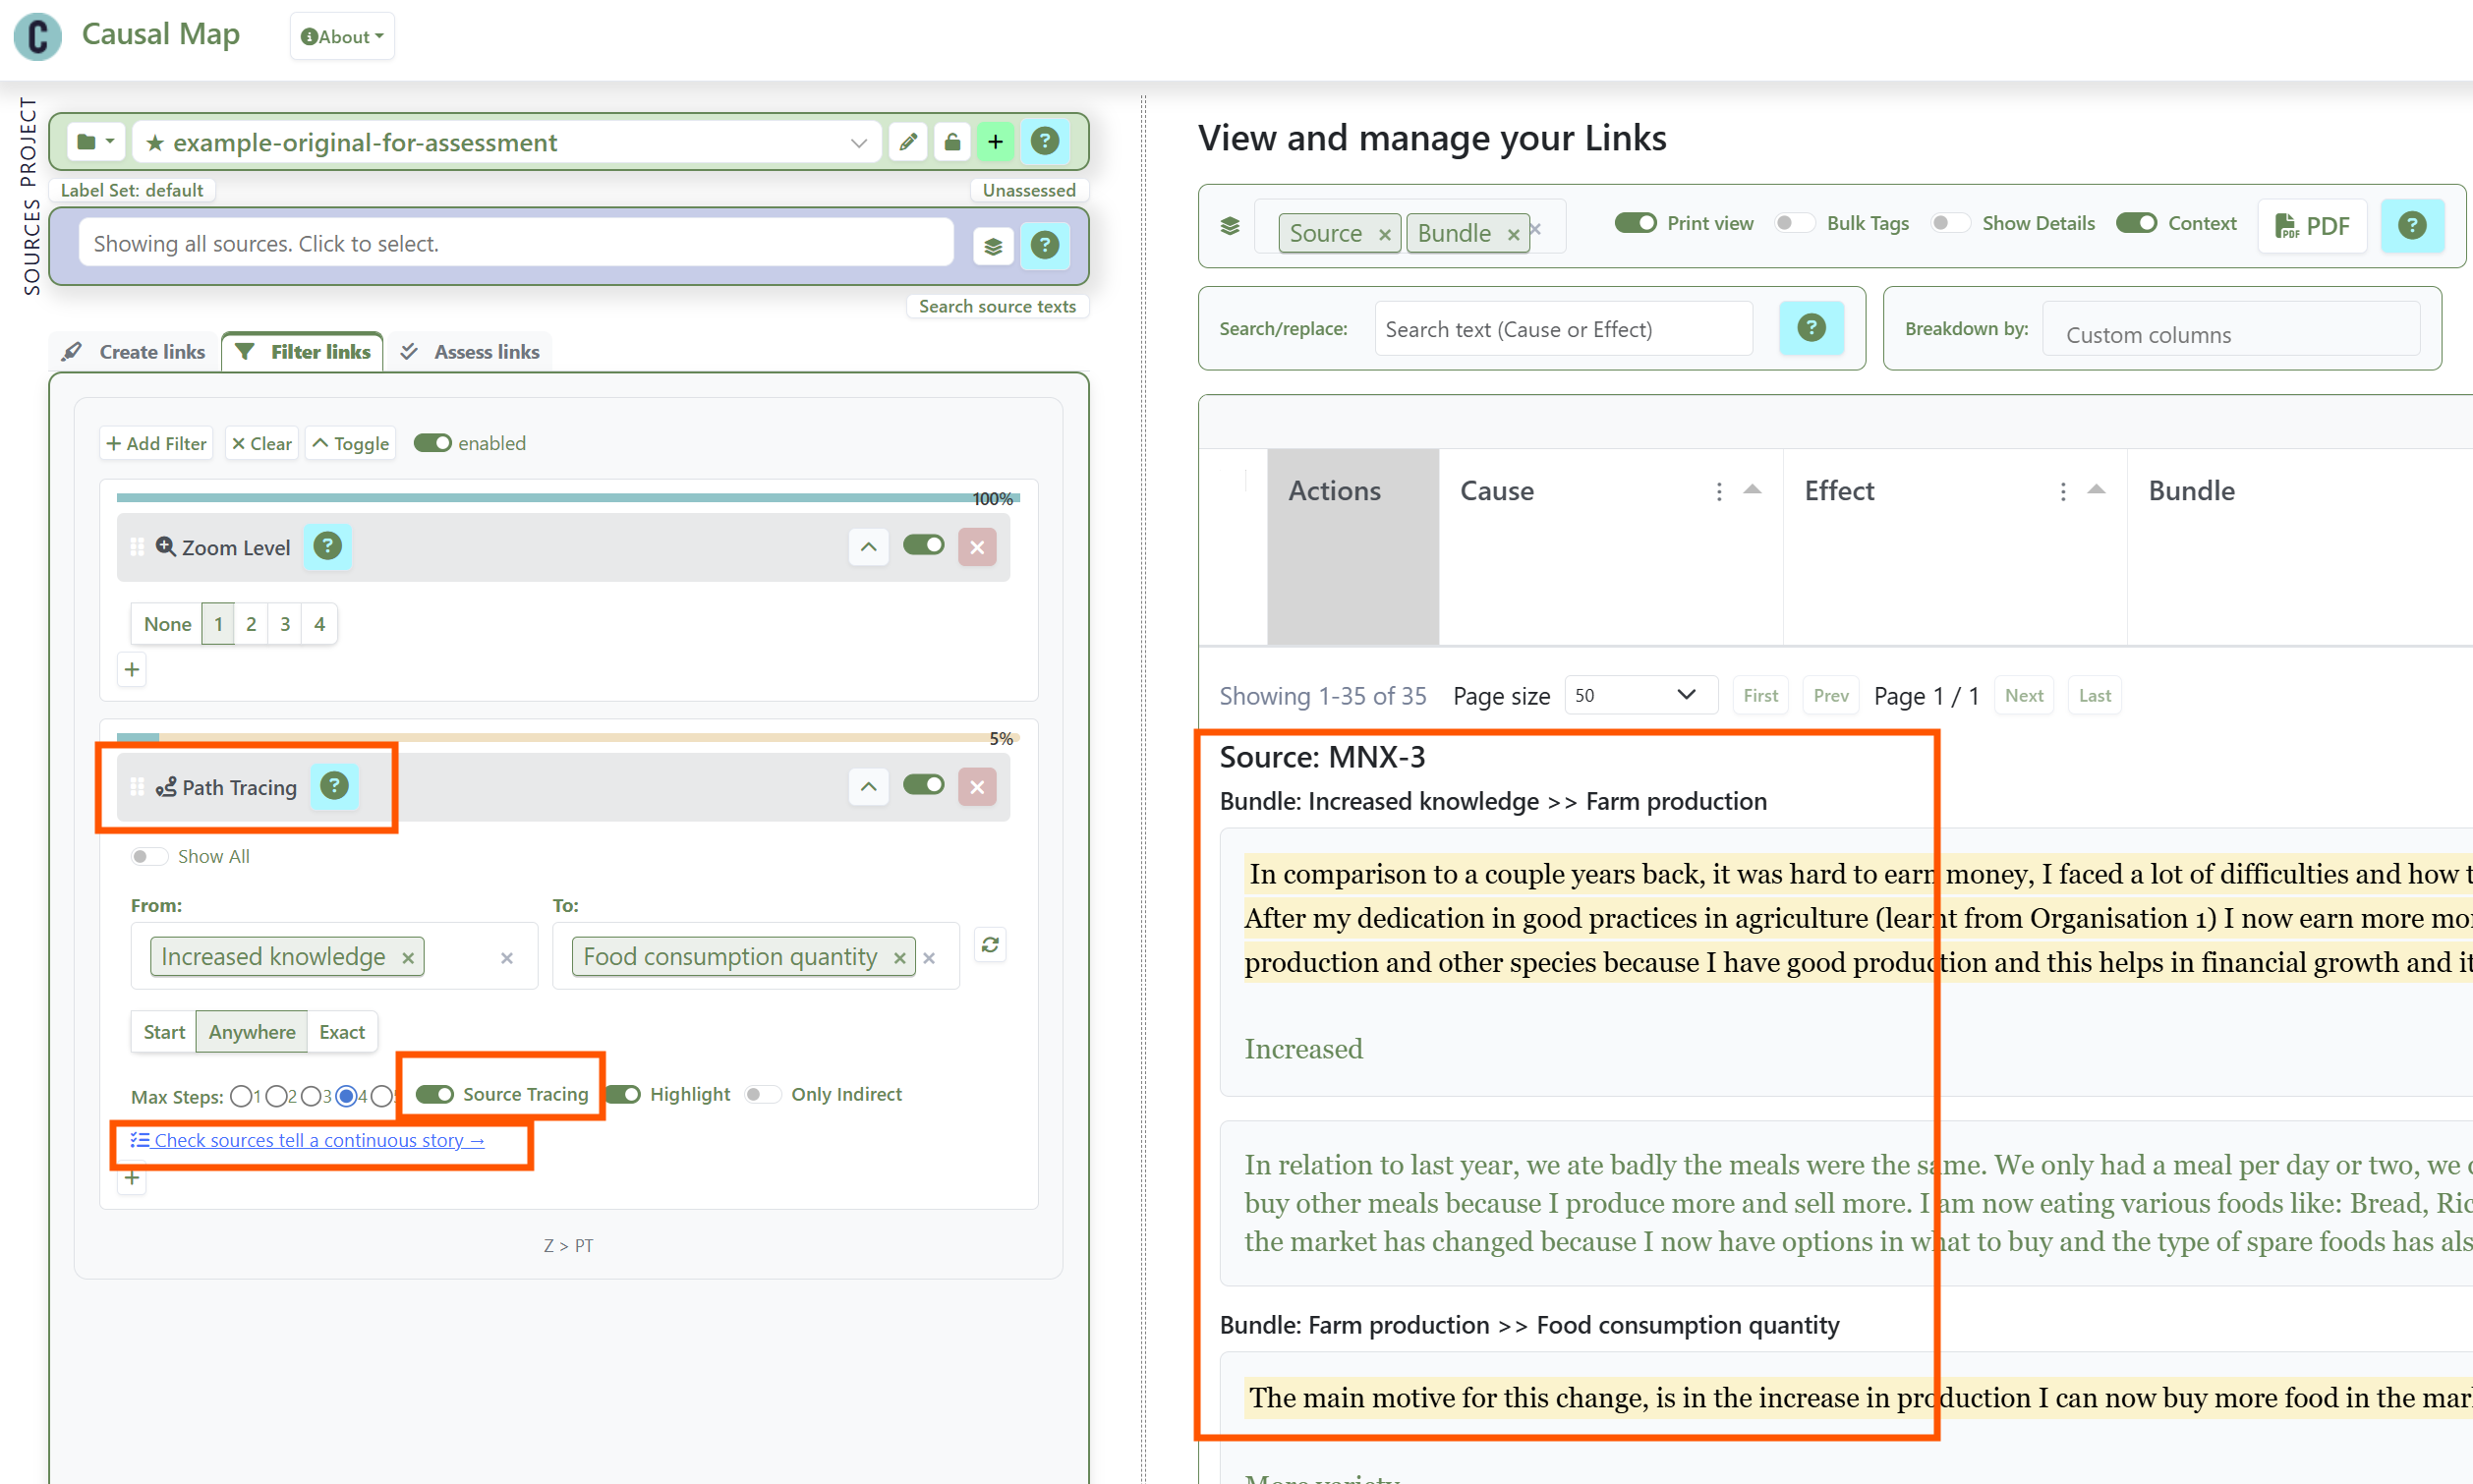 Setting up source tracing from Increased Knowledge to Food Consumption Quantity, and reading the narratives.
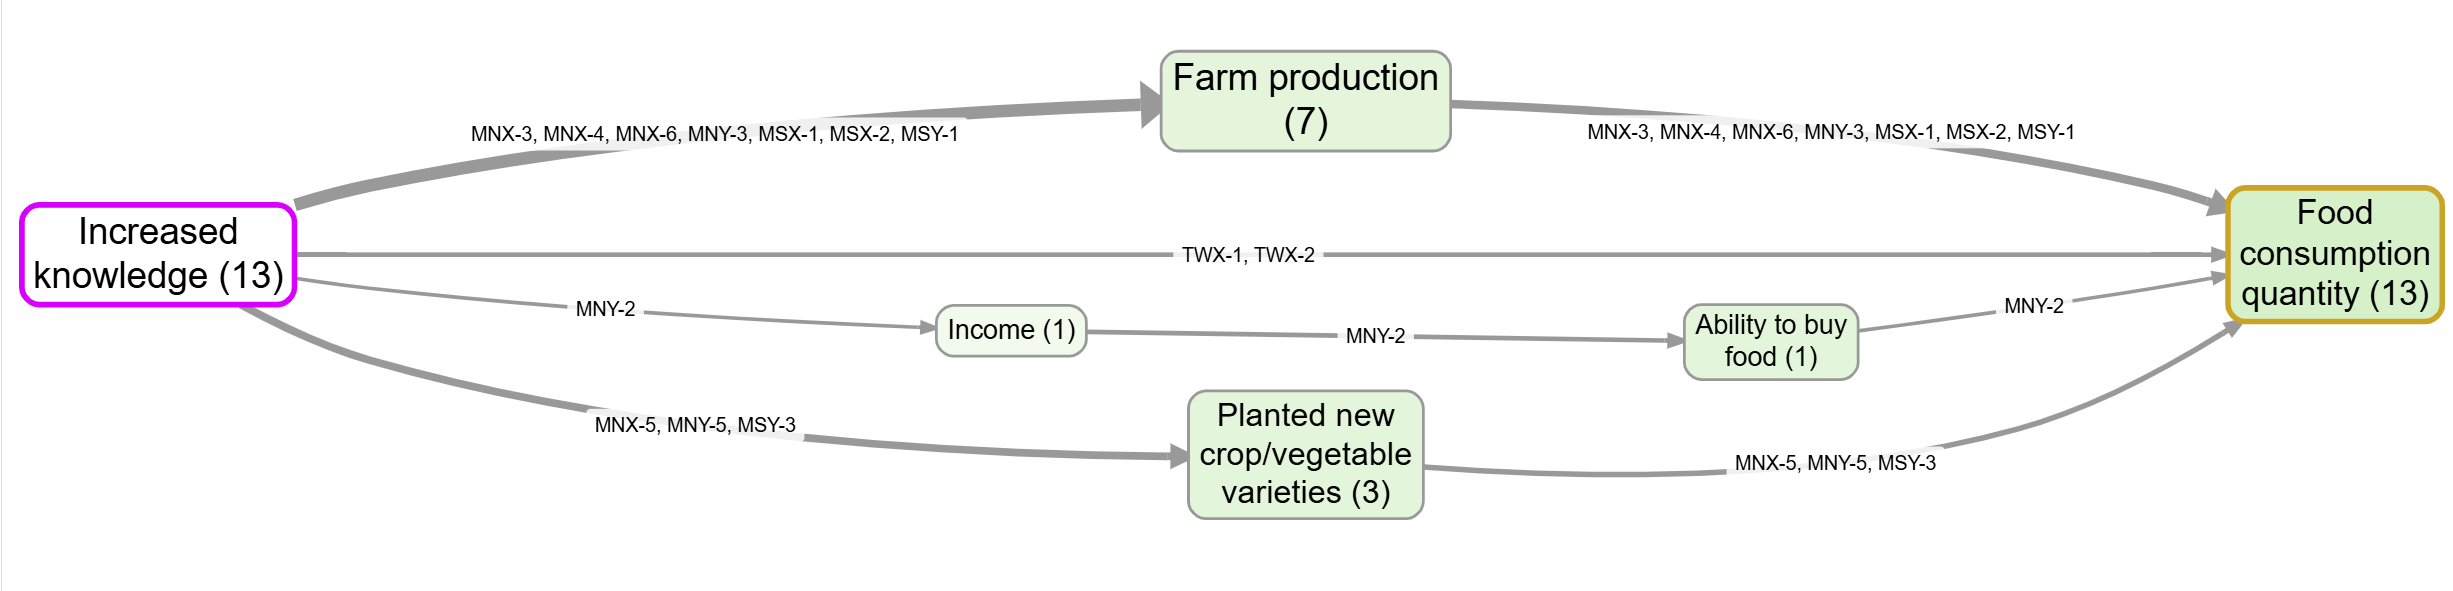 The matching map, here showing source IDs and counts for easy checking.
If you have assessed your bundles, you can trace on the assessed links (clean counts, no quotes) or the raw ones (quotes, busier map); often you will want both.
Step 8: Judge value and relative contribution#
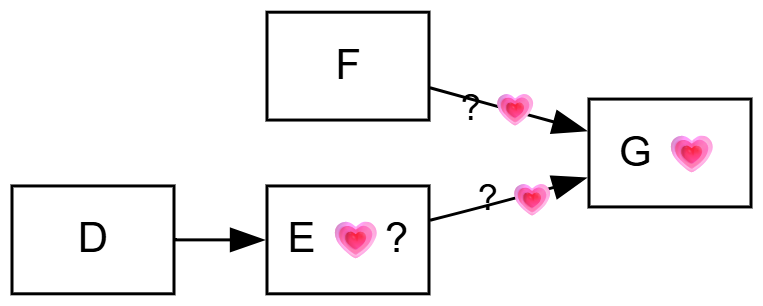
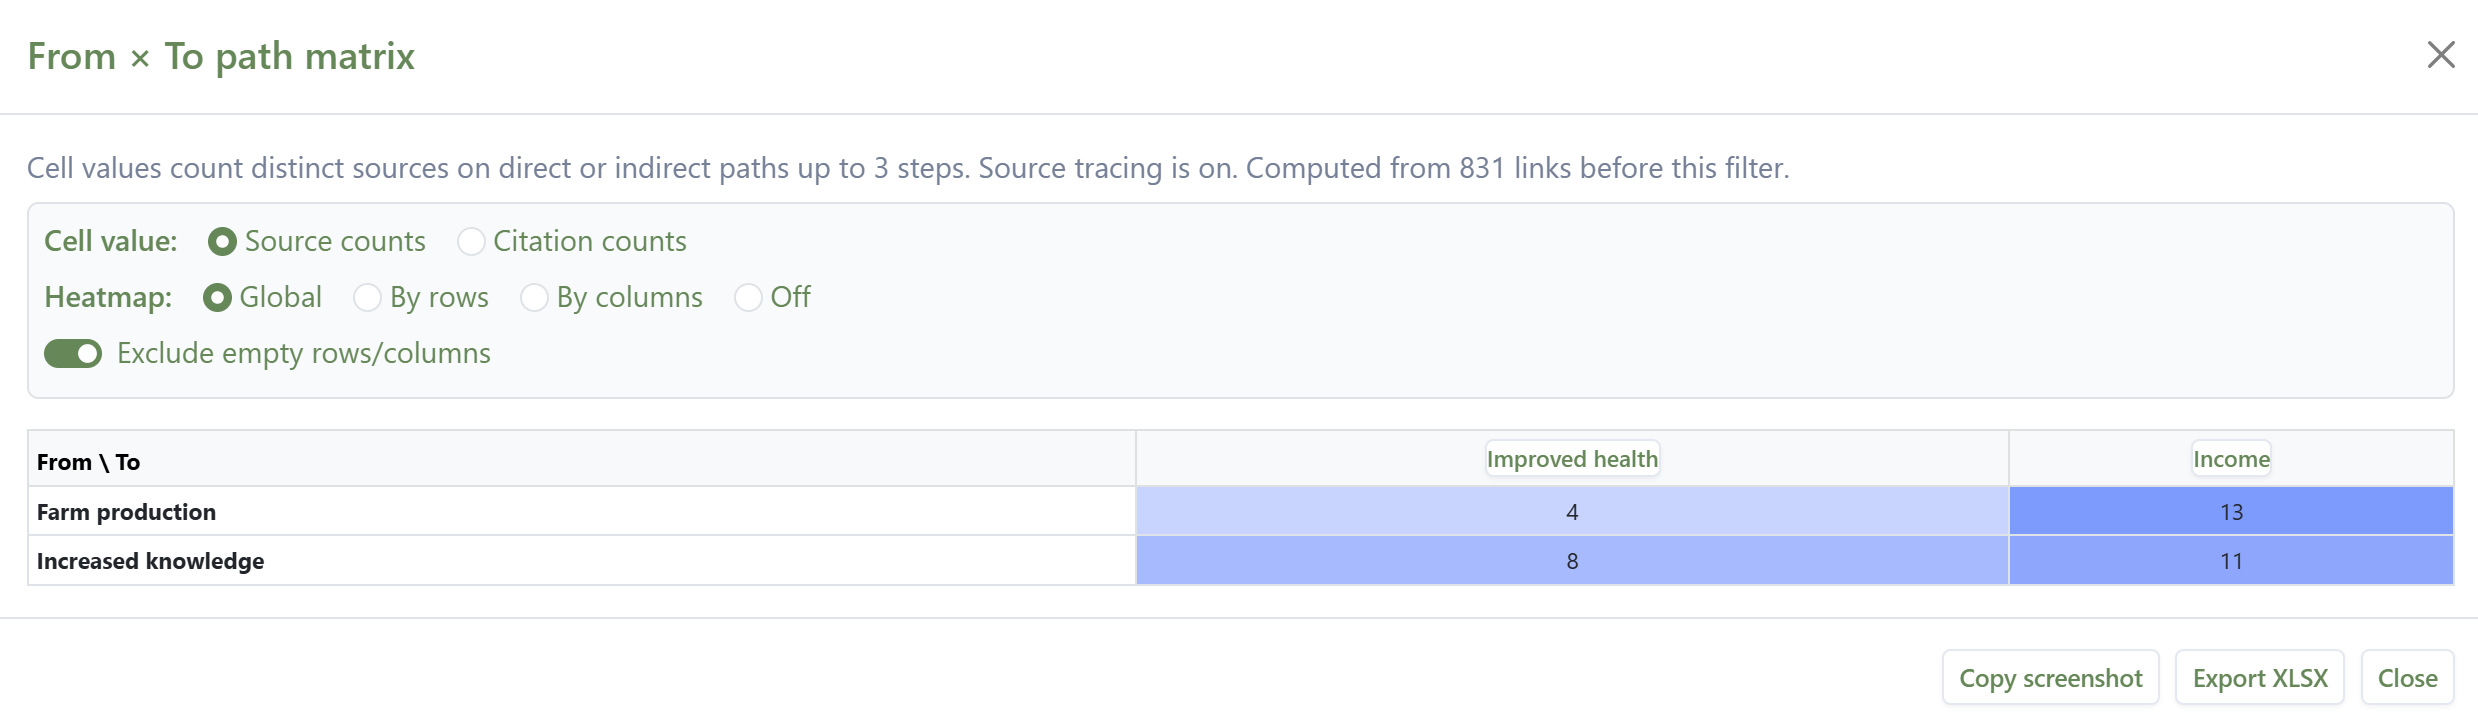
Judging how much something mattered, and weighing it against rival explanations, is central to evaluation and well covered elsewhere, not least by John Mayne (2019); QuIP has much to say on value (see Powell (2019)). The discipline is to compare your influence against the alternatives on the same map, not in isolation. For counting and comparing influences with path and source tracing, see Counting and comparing influences. For example, tracing the single-source narratives from two drivers to two outcomes:
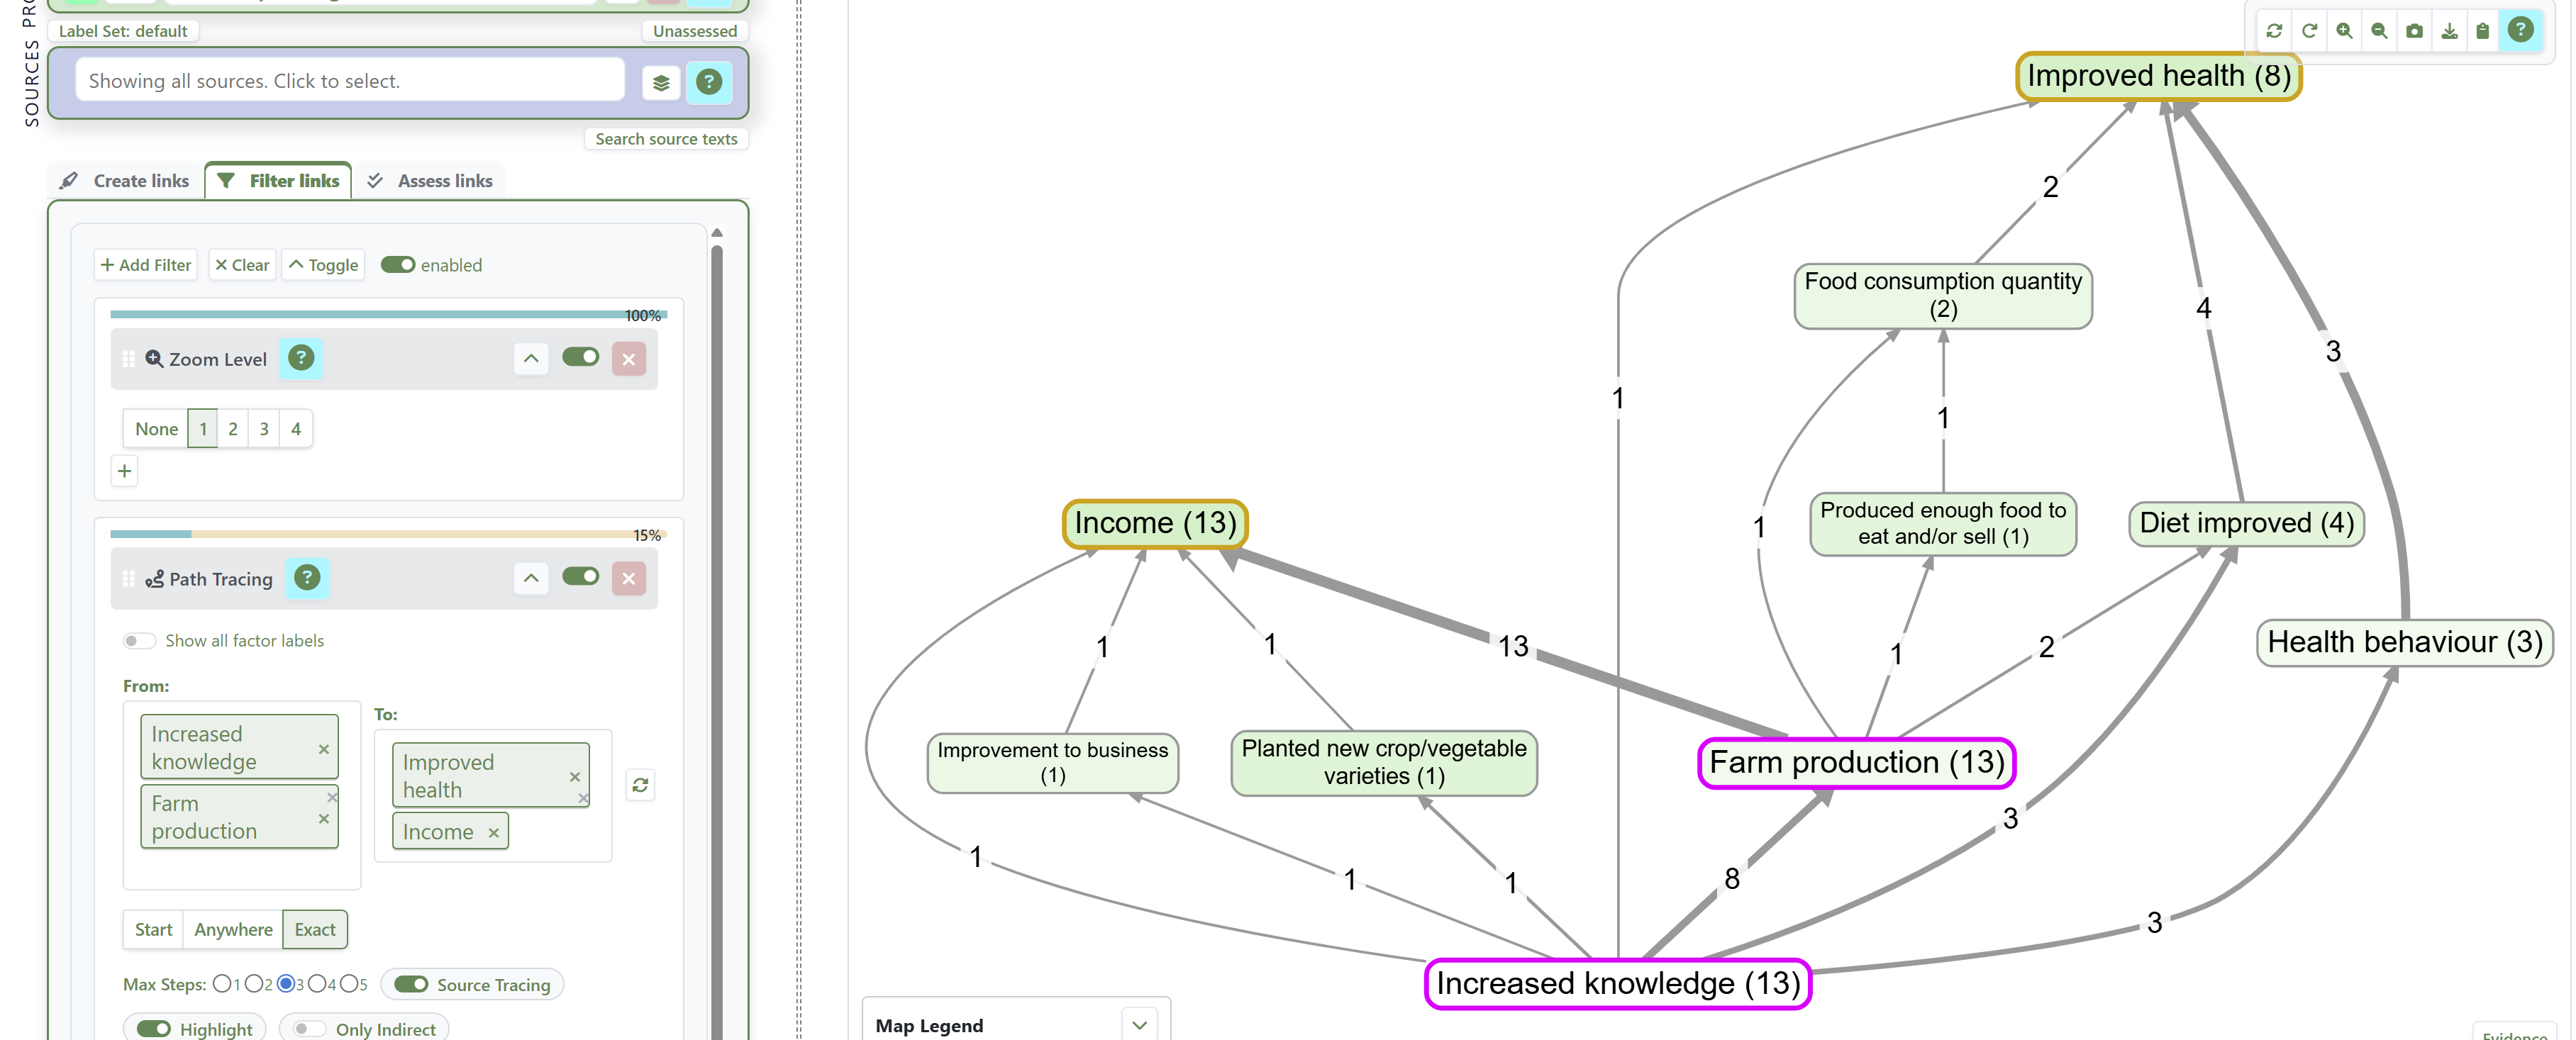
and counting the sources with a complete narrative between them:
Step 9: Holistic final judgement#
Finally, draw the conclusion. You have checked the claims, assessed the bundles, traced the pathways and weighed the alternatives; now look at all the evidence at once and decide. Behind a single map there may still be hundreds of quotes. Does the claim hold up? Do all the links really belong to the same context?
The AI vignette feature helps: it drafts a commentary on a view, drawing on the underlying paths, links, quotes and source data, and can answer set questions, for example "is each link part of one coherent story from intervention to outcome?".
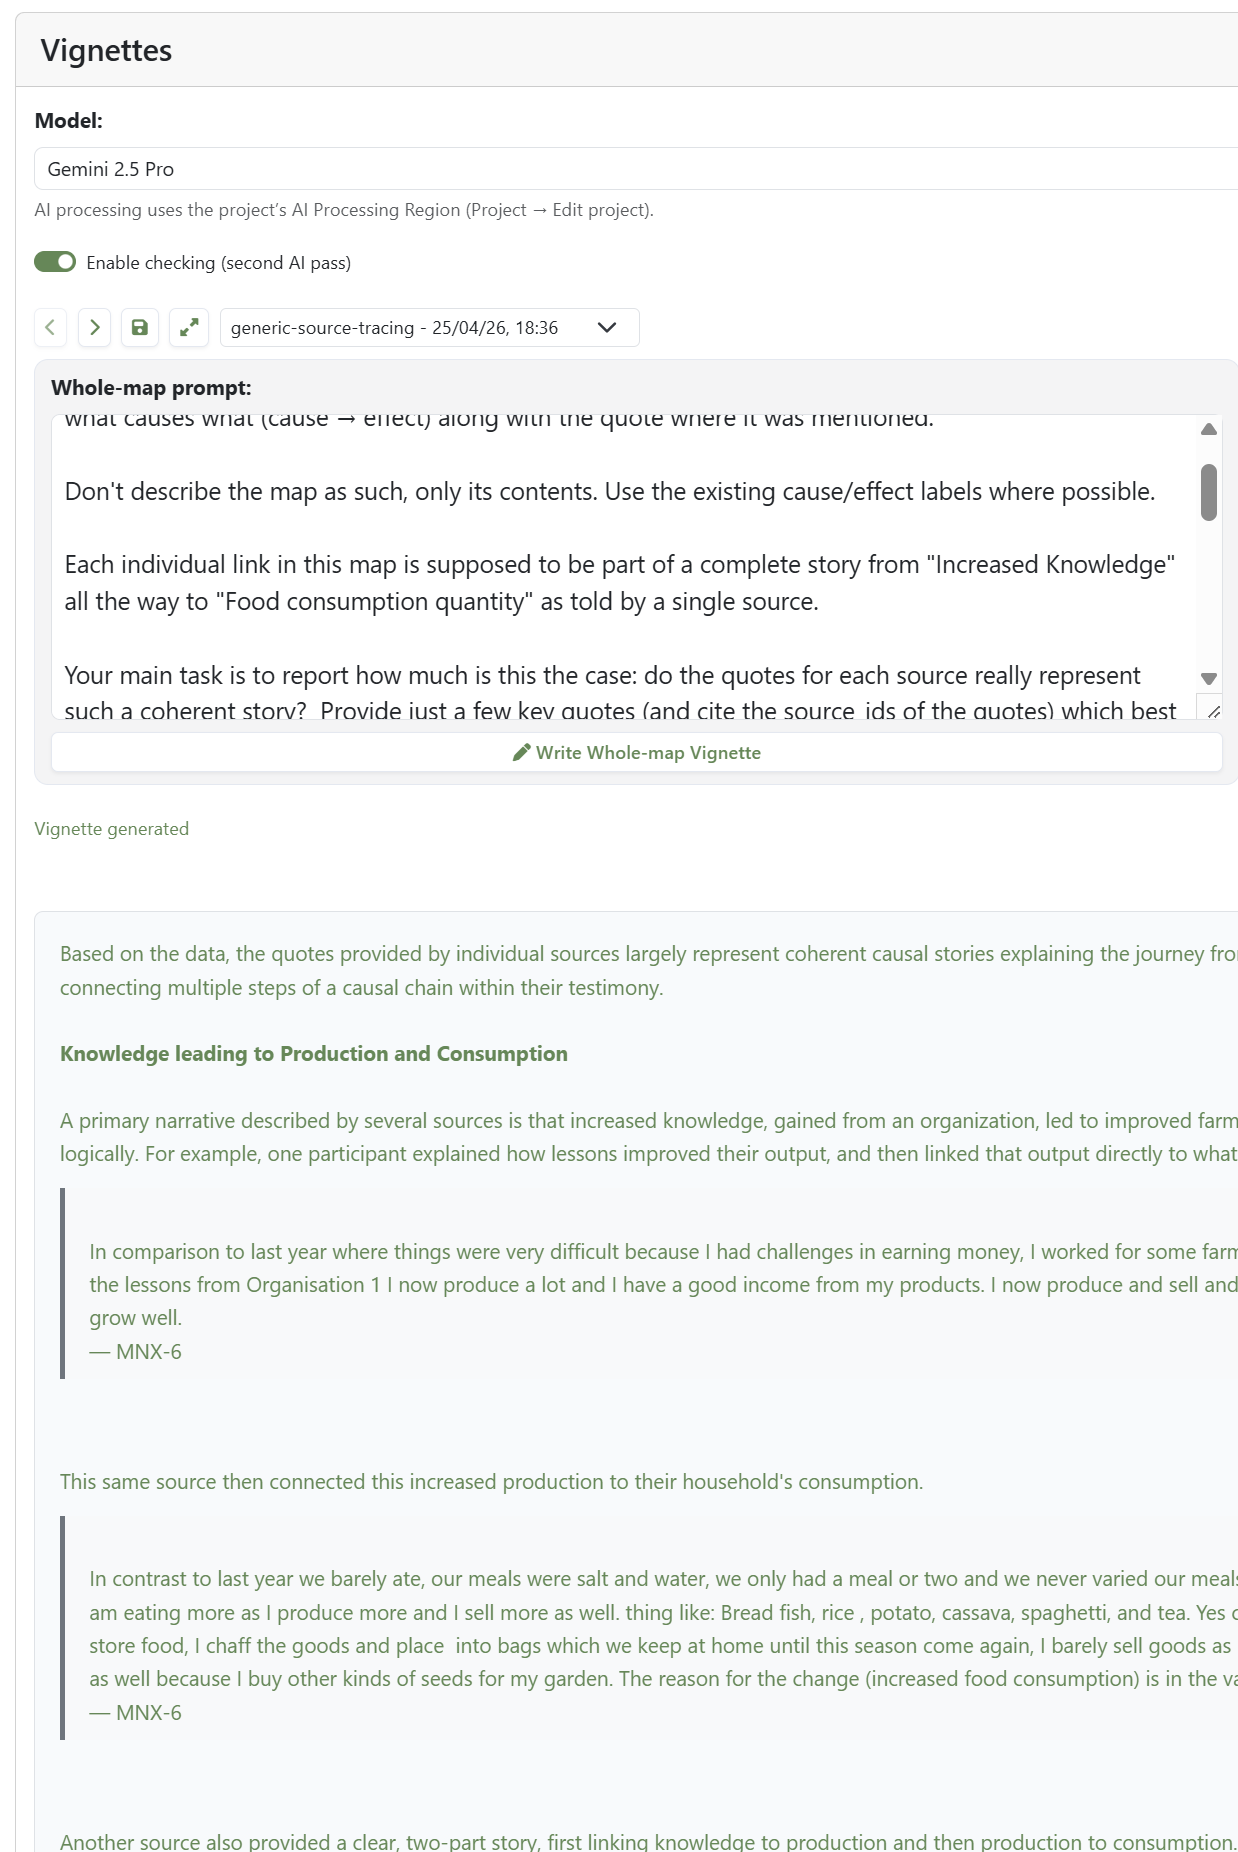
A common use is a source-by-source commentary on the pathways from an intervention to an outcome, judging how coherent each account is. The AI does only what a patient reader could do with the same quotes, so treat its draft as a starting point and edit it.
Then close the loop: does the evidence answer the question you set in Step 1?
Related#
- Quality assurance at each step of the causal coding workflow: the QA companion to this workflow
- Minimalist coding for causal mapping: the coding stance behind it
- Individual questions — introduction: the full menu of questions you can ask
- AI coding: app docs for the AI Coding panel
- AI answers panel: app docs for AI Answers
- Assessing quality or robustness of evidence for a causal link based on a bundle of coterminal causal claims: detail on the bundle step
- Just add rigour Three do’s and don’ts: do's and don'ts for AI text analysis
- Manually code your first project: a hands-on first project
References
Copestake, Morsink, & Remnant (2019). Attributing Development Impact: The Qualitative Impact Protocol Case Book. March 21, Online.
Lynn (2025). HU Seafood Retrospective. https://www.policysolve.com/resources/retrospective.
Mayne (2019). Assessing the Relative Importance of Causal Factors.
Powell (2019). Theories of Change: Making Value Explicit.